Difference Between M1 Money Supply and the Federal Reserve Balance Sheet

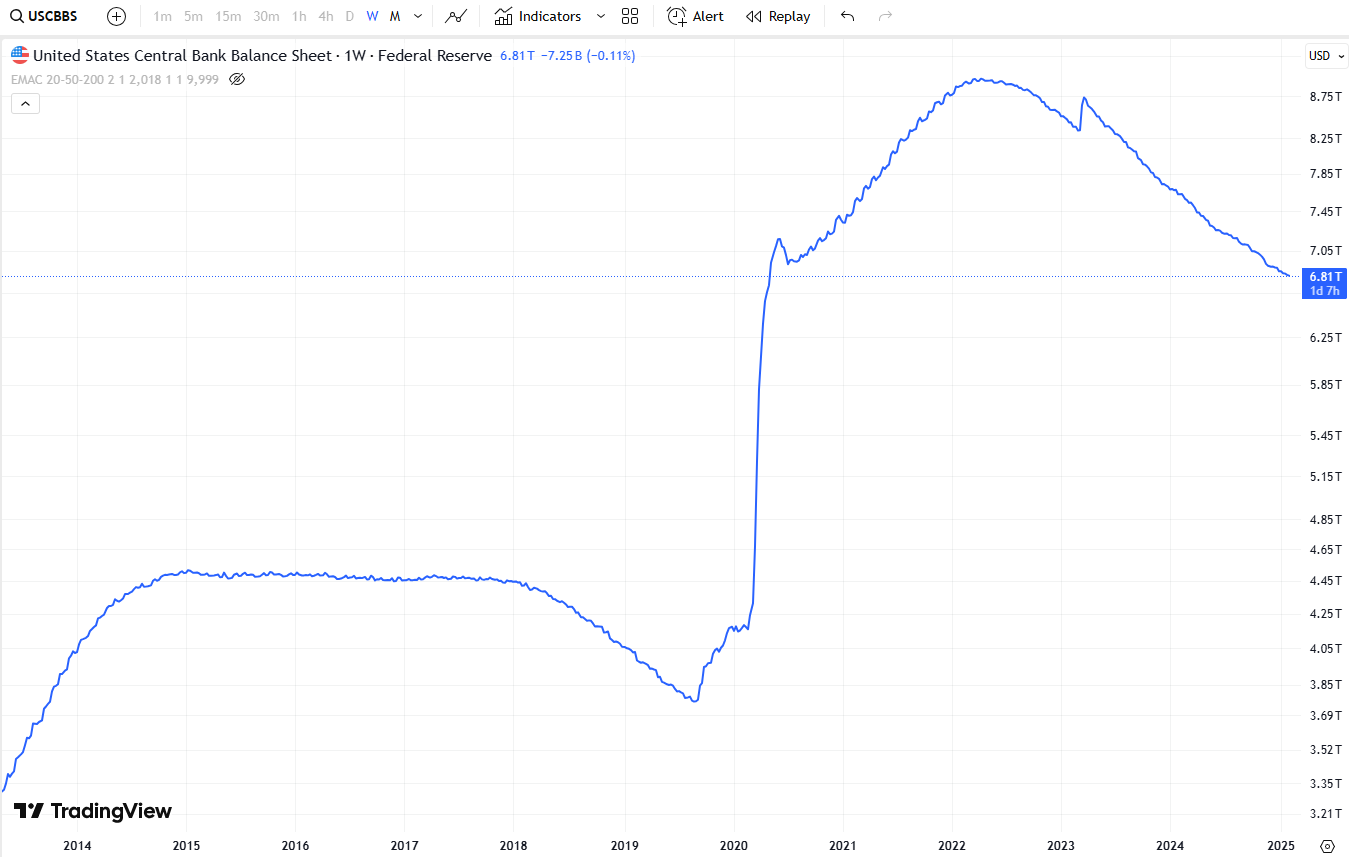
Chart from TradingView showing The Federal Reserve's balance sheet (Ticker: USCBBS)

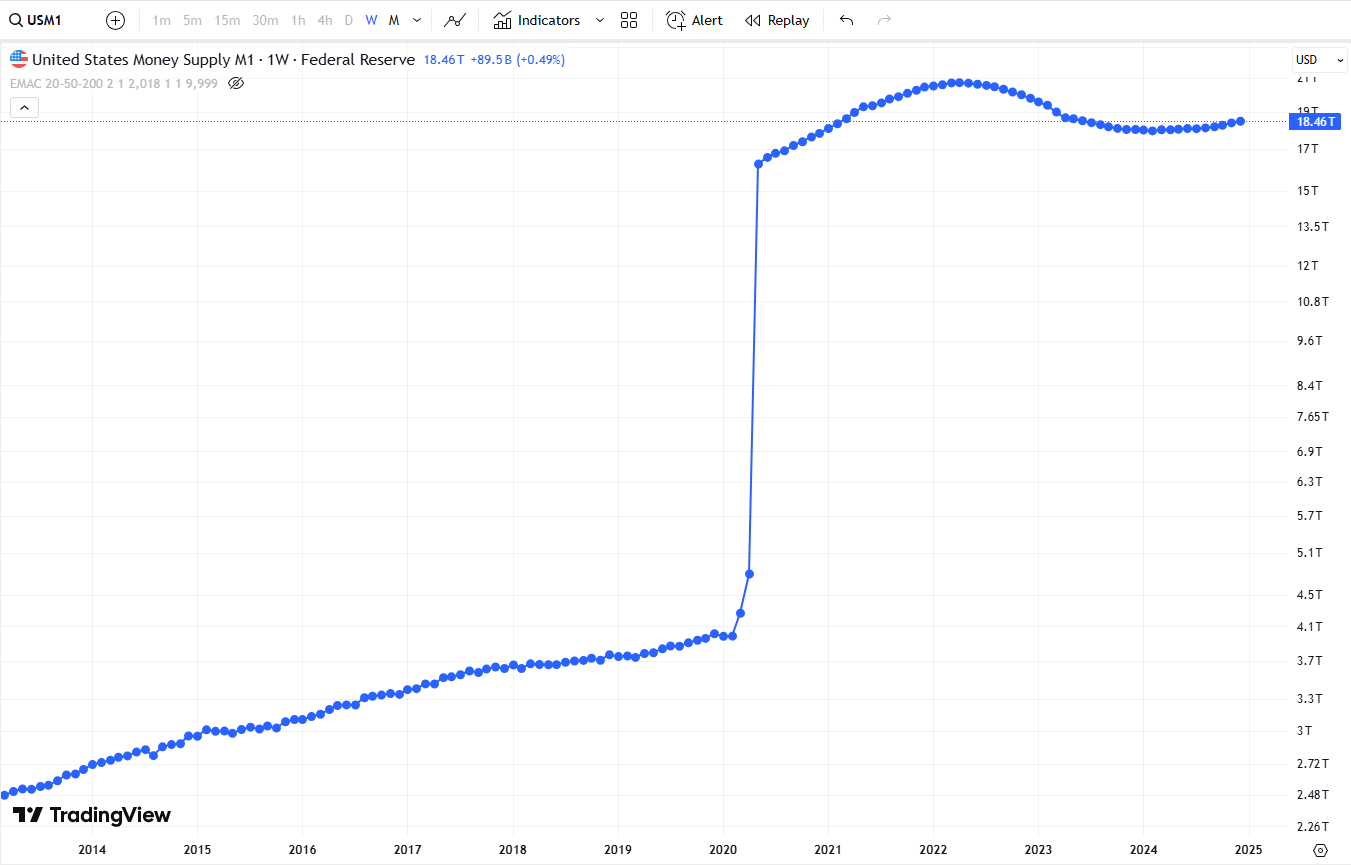
Chart from TradingView showing The US money supply M1 (Ticker: USM1)
While both M1 Money Supply and the Federal Reserve Balance Sheet relate to liquidity and monetary policy, they measure different aspects of the financial system. Understanding their differences is crucial for analyzing economic trends, inflation, and financial market movements.
1️⃣ M1 Money Supply (TradingView ticker: USM1)
What is it? M1 measures the most liquid money in circulation, including:
- Physical cash & coins
- Demand deposits (checking accounts)
- Other liquid deposits (e.g., traveler's checks)
Purpose: M1 represents the portion of money that is immediately available for transactions and spending in the economy.
How It Affects Markets:
- Increase in M1 → More spending power → Economic growth & inflation
- Decrease in M1 → Less spending power → Economic slowdown & deflation risk
Historically, M1 increases when central banks expand the money supply, either through lowering interest rates or injecting liquidity into the banking system. However, its impact also depends on **monetary velocity**—the speed at which money circulates in the economy. A high M1 with low velocity may not necessarily result in inflation, while a rising velocity can amplify inflationary effects.
2️⃣ Federal Reserve Balance Sheet (TradingView ticker: USCBBS)
What is it? The Fed’s balance sheet tracks the total assets and liabilities of the central bank, including:
- Assets: U.S. Treasuries, mortgage-backed securities (MBS), and other financial assets.
- Liabilities: Commercial bank reserves and U.S. currency in circulation.
Purpose: The balance sheet reflects the Federal Reserve’s intervention in the financial system, particularly in times of crisis or economic stimulus efforts.
How It Affects Markets:
- Expansion (QE - Quantitative Easing) → More liquidity → Stock & Bitcoin rally
- Reduction (QT - Quantitative Tightening) → Less liquidity → Market correction
During periods of **quantitative easing (QE)**, the Fed purchases assets like U.S. Treasuries and MBS, increasing its balance sheet and injecting liquidity into the system. Conversely, **quantitative tightening (QT)** reduces liquidity, as the Fed allows assets to mature without reinvesting or actively sells securities.
3️⃣ Key Differences
| Feature | M1 Money Supply | Federal Reserve Balance Sheet |
|---|---|---|
| Definition | Total liquid money (cash + deposits). | Total assets & liabilities of the Fed. |
| What it Measures? | How much spendable money is in circulation. | Size of the Fed’s monetary interventions. |
| Main Components | Cash, checking deposits, liquid bank accounts. | Treasuries, mortgage-backed securities, bank reserves. |
| Impact on Markets | Higher M1 = More liquidity = Bullish markets. | QE increases balance sheet = Bullish for risk assets. |
4️⃣ How Are They Related?
- The Fed’s actions influence M1: QE injects liquidity → Banks lend more → M1 rises.
- M1 affects consumer & business spending, while the Fed’s balance sheet affects financial markets.
- Bitcoin & stocks respond to both: High M1 = More money to invest, High Fed Balance Sheet = Direct liquidity boost.
Although they are related, M1 and the Fed's balance sheet do not always move in tandem. In some periods, M1 can remain high even when the Fed reduces its balance sheet, if other sources of liquidity—such as fiscal stimulus or commercial bank lending—offset the decline.
5️⃣ 🔍 Why Is This Important in 2025?
- The Fed’s balance sheet has been shrinking (QT) since mid-2022, but M1 remains high.
- Markets are forward-looking and began pricing in 2025 rate cuts after the Fed signaled a policy shift in late 2024.
- If both M1 and the Fed balance sheet decline sharply, risk assets could face a correction.
Even though the Fed has been reducing its balance sheet, M1 has remained elevated, indicating that liquidity is still present in the economy. If M1 starts declining alongside the Fed's QT, this could create liquidity shortages, potentially leading to a stock market correction and reduced risk appetite.
🔥 Conclusion
- M1 = Money supply available for spending & investment.
- Fed Balance Sheet = Liquidity created by the central bank.
- They are related but not identical.
- If both decline together, it’s bearish for stocks & Bitcoin.
- Monitoring both indicators is key to understanding economic and market cycles.