Understanding Global Liquidity: The Key to Market Cycles

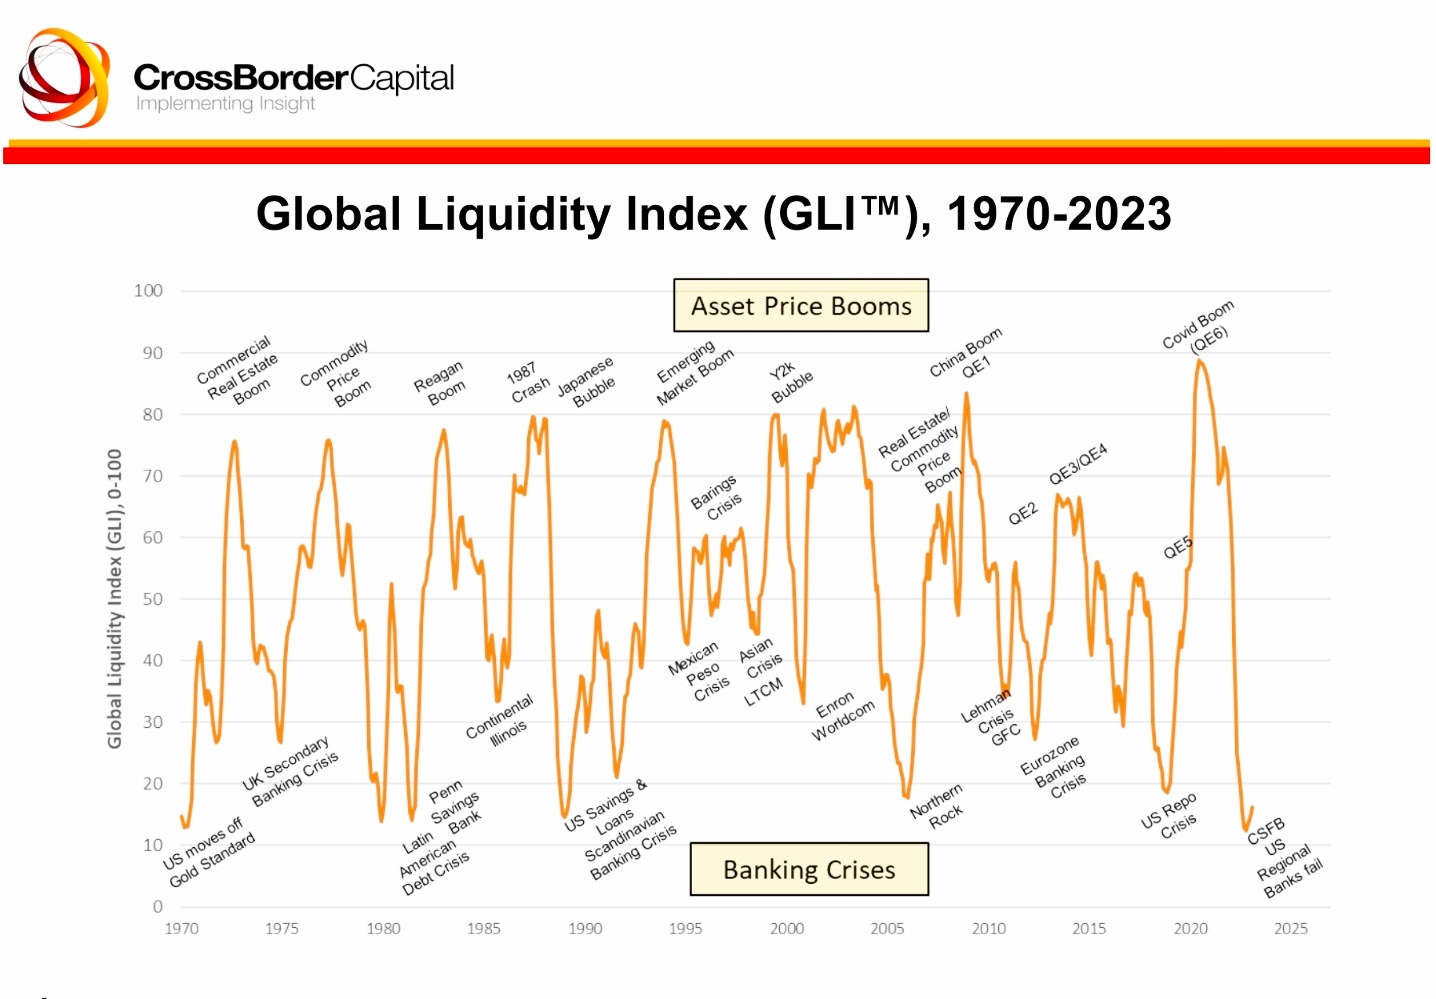
Chart from CrossBorder Capital showing the Global Liquidity Index (GLI).
Global liquidity plays a crucial role in shaping financial markets. Whether it’s stocks, bonds, or Bitcoin, liquidity fuels price movements and investor sentiment. But how do we measure global liquidity, and what indicators should traders and investors follow?
1️⃣ What is Global Liquidity?
Global liquidity refers to the total amount of money and credit available in the financial system. It determines how easily businesses, consumers, and investors can access capital.
🔹 Key Sources of Liquidity:
- Central Bank Balance Sheets (Fed, ECB, BoJ, PBoC)
- Money Supply (M1, M2, M3)
- Credit Growth & Bank Lending
- Financial Conditions (Interest Rates, Bond Yields)
- U.S. Dollar Strength & Global FX Markets
When liquidity expands, financial assets tend to rise. When liquidity contracts, markets face stress.
2️⃣ The Most Important Global Liquidity Indicators
| Indicator | Why It Matters | Where to Track |
|---|---|---|
| Central Bank Balance Sheets | Direct measure of QE/QT liquidity | FRED, ECB, BoJ, PBoC |
| M1, M2, M3 Money Supply | Tracks spendable money & credit | IMF, BIS, FRED |
| Reverse Repo (RRP) Usage | Measures excess cash parked by banks | NY Fed, FRED |
| Treasury General Account (TGA) | Gov’t liquidity injections/drains | U.S. Treasury |
| Credit Growth & Bank Lending | Shows real economy liquidity expansion | BIS, IMF, World Bank |
| U.S. Dollar Index (DXY) | A stronger dollar tightens global liquidity | TradingView, Bloomberg |
3️⃣ Composite Liquidity Indices
Rather than tracking each indicator separately, many investors follow liquidity indices:
🔹 Global Liquidity Index (GLI)
Created by CrossBorder Capital, the GLI tracks central bank balance sheets, money supply, and credit conditions.
🔹 Financial Conditions Index (FCI)
Goldman Sachs, Bloomberg, and the Chicago Fed publish FCIs, which track bond yields, credit spreads, and equity market conditions.
4️⃣ How Liquidity Affects Markets
📈 When Liquidity is High:
- Stock markets (NASDAQ, S&P 500) rally.
- Bitcoin & crypto see capital inflows.
- Bonds remain stable or rally.
- Risk assets outperform safe-haven assets.
📉 When Liquidity is Tightening:
- Stock market volatility increases.
- Bitcoin & speculative assets decline.
- Bond yields rise, making borrowing expensive.
- Emerging markets struggle due to a stronger USD.
5️⃣ 🔍 Why Is This Important in 2024-2025?
- The Fed’s balance sheet has been shrinking (QT) since mid-2022, but M1 remains high.
- Markets are forward-looking and began pricing in 2025 rate cuts after the Fed signaled a policy shift in late 2024.
- If both M1 and the Fed balance sheet decline sharply, risk assets could face a correction.
🔥 Conclusion
- Liquidity is the lifeblood of financial markets.
- Monitoring central bank policies & financial conditions is essential.
- Bitcoin, NASDAQ, and bonds all respond to liquidity shifts.
- If liquidity remains high, risk assets can continue to rally.
- If liquidity contracts, expect volatility and corrections.